Mohamed Elzek and Kathryn S. Lilley, Cambridge Centre for Proteomics, Department of Biochemistry, The Milner Therapeutics Institute, University of Cambridge, Cambridge, UK
The interior of eukaryotic cells is characterised by a high degree of structural and functional partitioning into distinct microenvironments dedicated to diverse and specific roles. Trafficking between subcellular niches allows proteins to drive biological processes such as maintaining homeostasis and regulating stress response. Aberrant trafficking is known to be the root of many diseases 1,2. Methods such as microscopy or affinity tagging are essential to determine the location of individual proteins or protein repertoires of purified organelles 3,4. However, a thorough understanding of functional dynamics of the proteome, requires a high throughput ability to define the spatial context of the entire proteome of the cell across different cell types, conditions and time points. Many of the current spatial proteomics techniques have been inspired by the protein correlation profiling principle exploited by cell biologists in the 1950 and 1960 to uncover new organelle 5–12. Membrane bound organelles and protein complexes co-fractionate upon centrifugation purely on the basis of their physical properties such as size, shape and density. Proteins with similar distributions to those exhibited by organelle marker proteins are assigned a single or multiple locations. Since its inception, the Cambridge Centre for Proteomics has contributed extensively to the establishment of spatial proteomics as a field primarily through the development of a technique known as Localization of Organelle Proteins by Isotope Tagging (LOPIT).
The LOPIT approach combines organelle separation based on their characteristic buoyant densities or sedimentation rate by ultracentrifugation, with quantitative proteomics employing multiplexed by in vitro stable isotope labelling, highly sensitive mass spectrometers and multivariate statistical analysis (figure 1). Dunkley et al published the first draft of LOPIT In 2004, providing localisation annotations in Arabidopsis thaliana using Isotope-coded affinity tag (ICAT)5. A partial least squares-discriminant analysis (PLS-DA) algorithm enabled novel localisation of a number of proteins to ER, Golgi, and mitochondrial/plastid. Subsequently, the LOPIT methodology has evolved with the development of the field of mass spectrometry-based proteomics with the emergence of the multiplexing capacity of isotope labelling and the higher resolution of Orbitrap mass spectrometers. Furthermore, data analysis and visualisation tools have been tailored towards the output of LOPIT analysis. The pRoloc and pRolocGUI R packages cover a broad range of computational methods from unsupervised, supervised and semi-supervised machine learning, novelty detection and cluster separation assessment to, more recently, transfer learning and Bayesian modelling 13,14. Over the years, the applications of LOPIT extended to multiple biological systems, most recently the first protein atlas of Toxoplasma gondii 15–19.
In 2016, Christoforou and colleagues exquisitely portrayed the protein map of mouse stem cells in a single experiment15. This improved version of LOPIT was rebranded as hyperplexed LOPIT (hyperLOPIT) thanks to higher multiplexing capabilities of amine-reactive tandem mass tags (TMT) 10-plex, MS/MS acquisition using synchronous precursor selection to improve quantitative accuracy and application of support vector machines (SVM) for data analysis. Almost half of the mouse stem cell proteome were annotated to multiple subcellular locations which was later also supported by the human cell atlas project3. Moreover, hyperLOPIT enabled subcellular localisation of some protein isoforms, protein complexes and signalling pathways. A year ago, a comparable system-wide resolution was also obtained differential ultracentrifugation based LOPIT, or LOPIT-DC, in which the spatial proteome of human osteosarcoma U-2 OS cell line was fully characterised using less time, material and resources18.
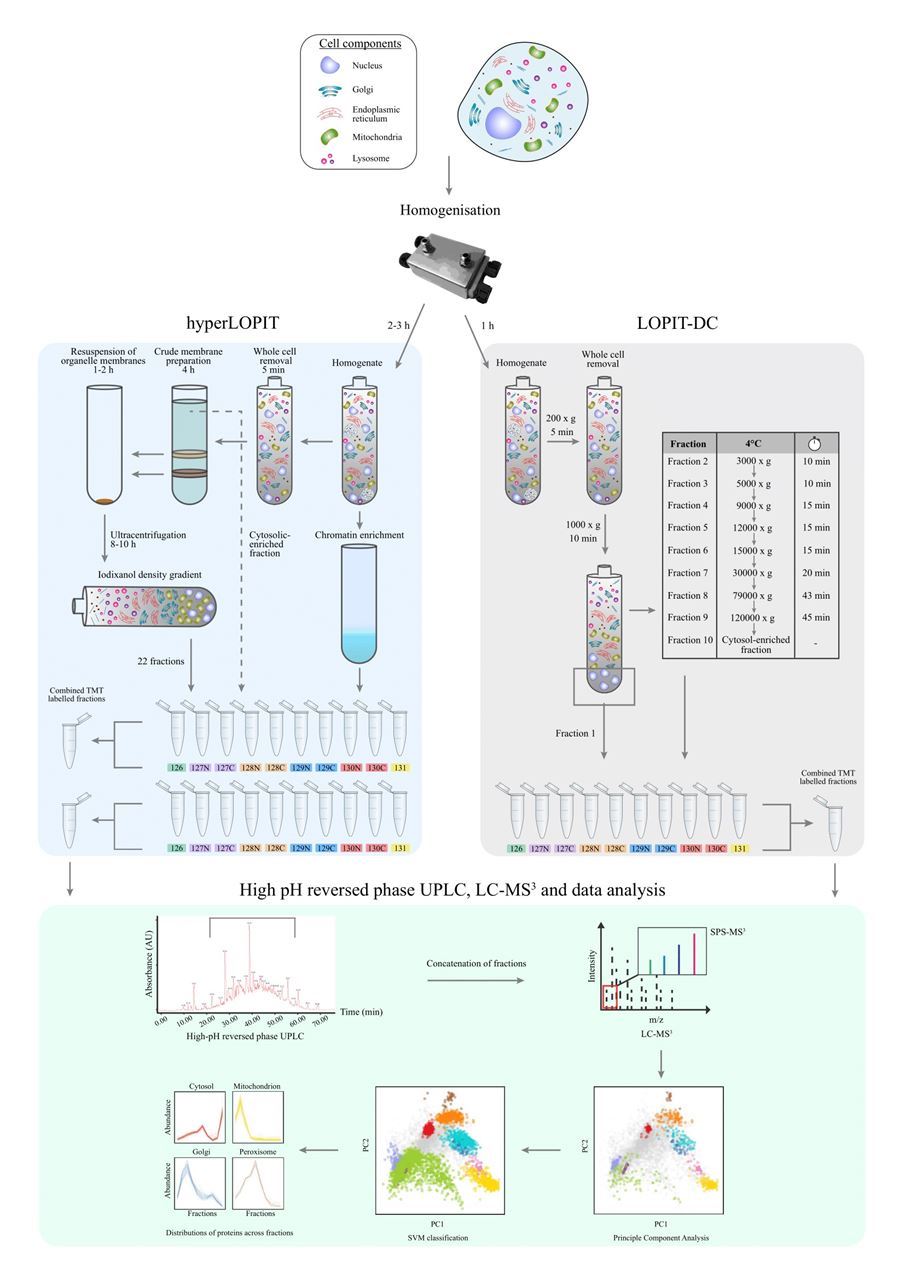
Figure 1: A schematic overview of HyperLOPIT (left) and LOPIT-DC (right) workflows
Membrane trafficking is an exemplar field which could benefit greatly from LOPIT. In particular, retrograde trafficking from endosomes to the trans-Golgi network (TGN) involves multiple partially redundant pathways that generate distinct pools of vesicles which are difficult to purify using other antibodies based techniques. Recently, Shin et al applied LOPIT-DC to characterise the endosome-to-Golgi vesicles that are selectively captured by golgin tethers at the TGN19. These golgins were ectopically redirected to mitochondria in order to determine the content of the specific endosome-to-Golgi vesicles they capture. Bayesian non-parametric testing was employed to identify protein movements towards the mitochondria. A profile shift of 45 transmembrane proteins and 51 peripheral membrane proteins of the endosomal network were detected including known cargo and trafficking machinery of the clathrin/AP-1, retromer-dependent and -independent transport pathways.These findings opens the exciting prospect of using LOPIT to interrogate dynamic spatial protein movements.
Spatial proteomics is still an emerging technology. The continual development of multiplexed mass spectrometry analysis promises enhanced subcellular resolution and motivating dynamic protein localisation studies while alleviating the technical variability 20. Furthermore, LOPIT is a modular technique which facilitates the use of complementary techniques such as RNA sequencing and metabolic profiling. The combination of LOPIT with transcriptomic and metabolic profiling in a spatial multi-omics map has the capacity to drastically reshape our understanding of cell biology. In conclusion, LOPIT has been substantially developed to be a user-friendly approach with the availability of detailed online experimental protocols and an open-source bioinformatics suite 14,21,22. We encourage our readers to consider applying workflows such as LOPIT to their experiments to harness the power of spatial proteomics.
References
1. Wang, E. T. et al. Dysregulation of mRNA Localization and Translation in Genetic Disease. J. Neurosci. Off. J. Soc. Neurosci. 36, 11418–11426 (2016).
2. Bridges, R. J. & Bradbury, N. A. Cystic Fibrosis, Cystic Fibrosis Transmembrane Conductance Regulator and Drugs: Insights from Cellular Trafficking. in Targeting Trafficking in Drug Development (eds. Ulloa-Aguirre, A. & Tao, Y.-X.) 385–425 (Springer International Publishing, 2018). doi:10.1007/164_2018_103.
3. Thul, P. J. et al. A subcellular map of the human proteome. Science 356, (2017).
4. Go, C. D. et al. A proximity biotinylation map of a human cell. bioRxiv 796391 (2019) doi:10.1101/796391.
5. Dunkley, T. P. J., Watson, R., Griffin, J. L., Dupree, P. & Lilley, K. S. Localization of organelle proteins by isotope tagging (LOPIT). Mol. Cell. Proteomics MCP 3, 1128–1134 (2004).
6. Foster, L. J. et al. A mammalian organelle map by protein correlation profiling. Cell 125, 187–199 (2006).
7. Jean Beltran, P. M., Mathias, R. A. & Cristea, I. M. A Portrait of the Human Organelle Proteome In Space and Time during Cytomegalovirus Infection. Cell Syst. 3, 361-373.e6 (2016).
8. De Duve, C. Tissue fractionation. Past and present. J. Cell Biol. 50, 20d–55d (1971).
9. Itzhak, D. N. et al. A Mass Spectrometry-Based Approach for Mapping Protein Subcellular Localization Reveals the Spatial Proteome of Mouse Primary Neurons. Cell Rep. 20, 2706–2718 (2017).
10. Krahmer, N. et al. Organellar Proteomics and Phospho-Proteomics Reveal Subcellular Reorganization in Diet-Induced Hepatic Steatosis. Dev. Cell 47, 205-221.e7 (2018).
11. Orre, L. M. et al. SubCellBarCode: Proteome-wide Mapping of Protein Localization and Relocalization. Mol. Cell 73, 166-182.e7 (2019).
12. Jadot, M. et al. Accounting for Protein Subcellular Localization: A Compartmental Map of the Rat Liver Proteome. Mol. Cell. Proteomics MCP 16, 194–212 (2017).
13. Gatto, L., Breckels, L. M., Wieczorek, S., Burger, T. & Lilley, K. S. Mass-spectrometry-based spatial proteomics data analysis using pRoloc and pRolocdata. Bioinformatics 30, 1322–1324 (2014).
14. Crook, O. M., Breckels, L. M., Lilley, K. S., Kirk, P. D. W. & Gatto, L. A Bioconductor workflow for the Bayesian analysis of spatial proteomics. F1000Research 8, 446 (2019).
15. Christoforou, A. et al. A draft map of the mouse pluripotent stem cell spatial proteome. Nat. Commun. 7, 1–12 (2016).
16. Nightingale, D. J., Geladaki, A., Breckels, L. M., Oliver, S. G. & Lilley, K. S. The subcellular organisation of Saccharomyces cerevisiae. Curr. Opin. Chem. Biol. 48, 86–95 (2019).
17. Barylyuk, K. et al. A subcellular atlas of Toxoplasma reveals the functional context of the proteome. bioRxiv 2020.04.23.057125 (2020) doi:10.1101/2020.04.23.057125.
18. Geladaki, A. et al. Combining LOPIT with differential ultracentrifugation for high-resolution spatial proteomics. Nat. Commun. 10, 1–15 (2019).
19. Shin, J. J. H. et al. Determining the content of vesicles captured by golgin tethers using LOPIT-DC. bioRxiv 841965 (2019) doi:10.1101/841965.
20. Thompson, A. et al. TMTpro: Design, Synthesis, and Initial Evaluation of a Proline-Based Isobaric 16-Plex Tandem Mass Tag Reagent Set. Anal. Chem. 91, 15941–15950 (2019).
21. Mulvey, C. M. et al. Using hyperLOPIT to perform high-resolution mapping of the spatial proteome. Nat. Protoc. 12, 1110–1135 (2017).
22. Breckels, L. M., Mulvey, C. M., Lilley, K. S. & Gatto, L. A Bioconductor workflow for processing and analysing spatial proteomics data. F1000Research 5, 2926 (2018).


.png)